Is a Sri Lanka destination rating meaningful? What 363,148 reviews say
Every travel site in Sri Lanka publishes the same list: destinations ranked by their average review score. Habarana at the top, Jaffna at the bottom. It is a tidy, shareable artefact, and it is built on real data — ours included, we have published several versions of it.
This study asks the question we should have asked first: does that number predict anything? Not whether it is computed correctly — whether a destination average tells you anything about the night you are about to book. The answer is a very small number, and the reasons behind it are more useful than the ranking itself.
All figures below come from our live 363,148-review corpus of verified Sri Lanka stays, pulled directly from the database by a script that ships next to this page. Nothing is hand-entered.
The Short Answer
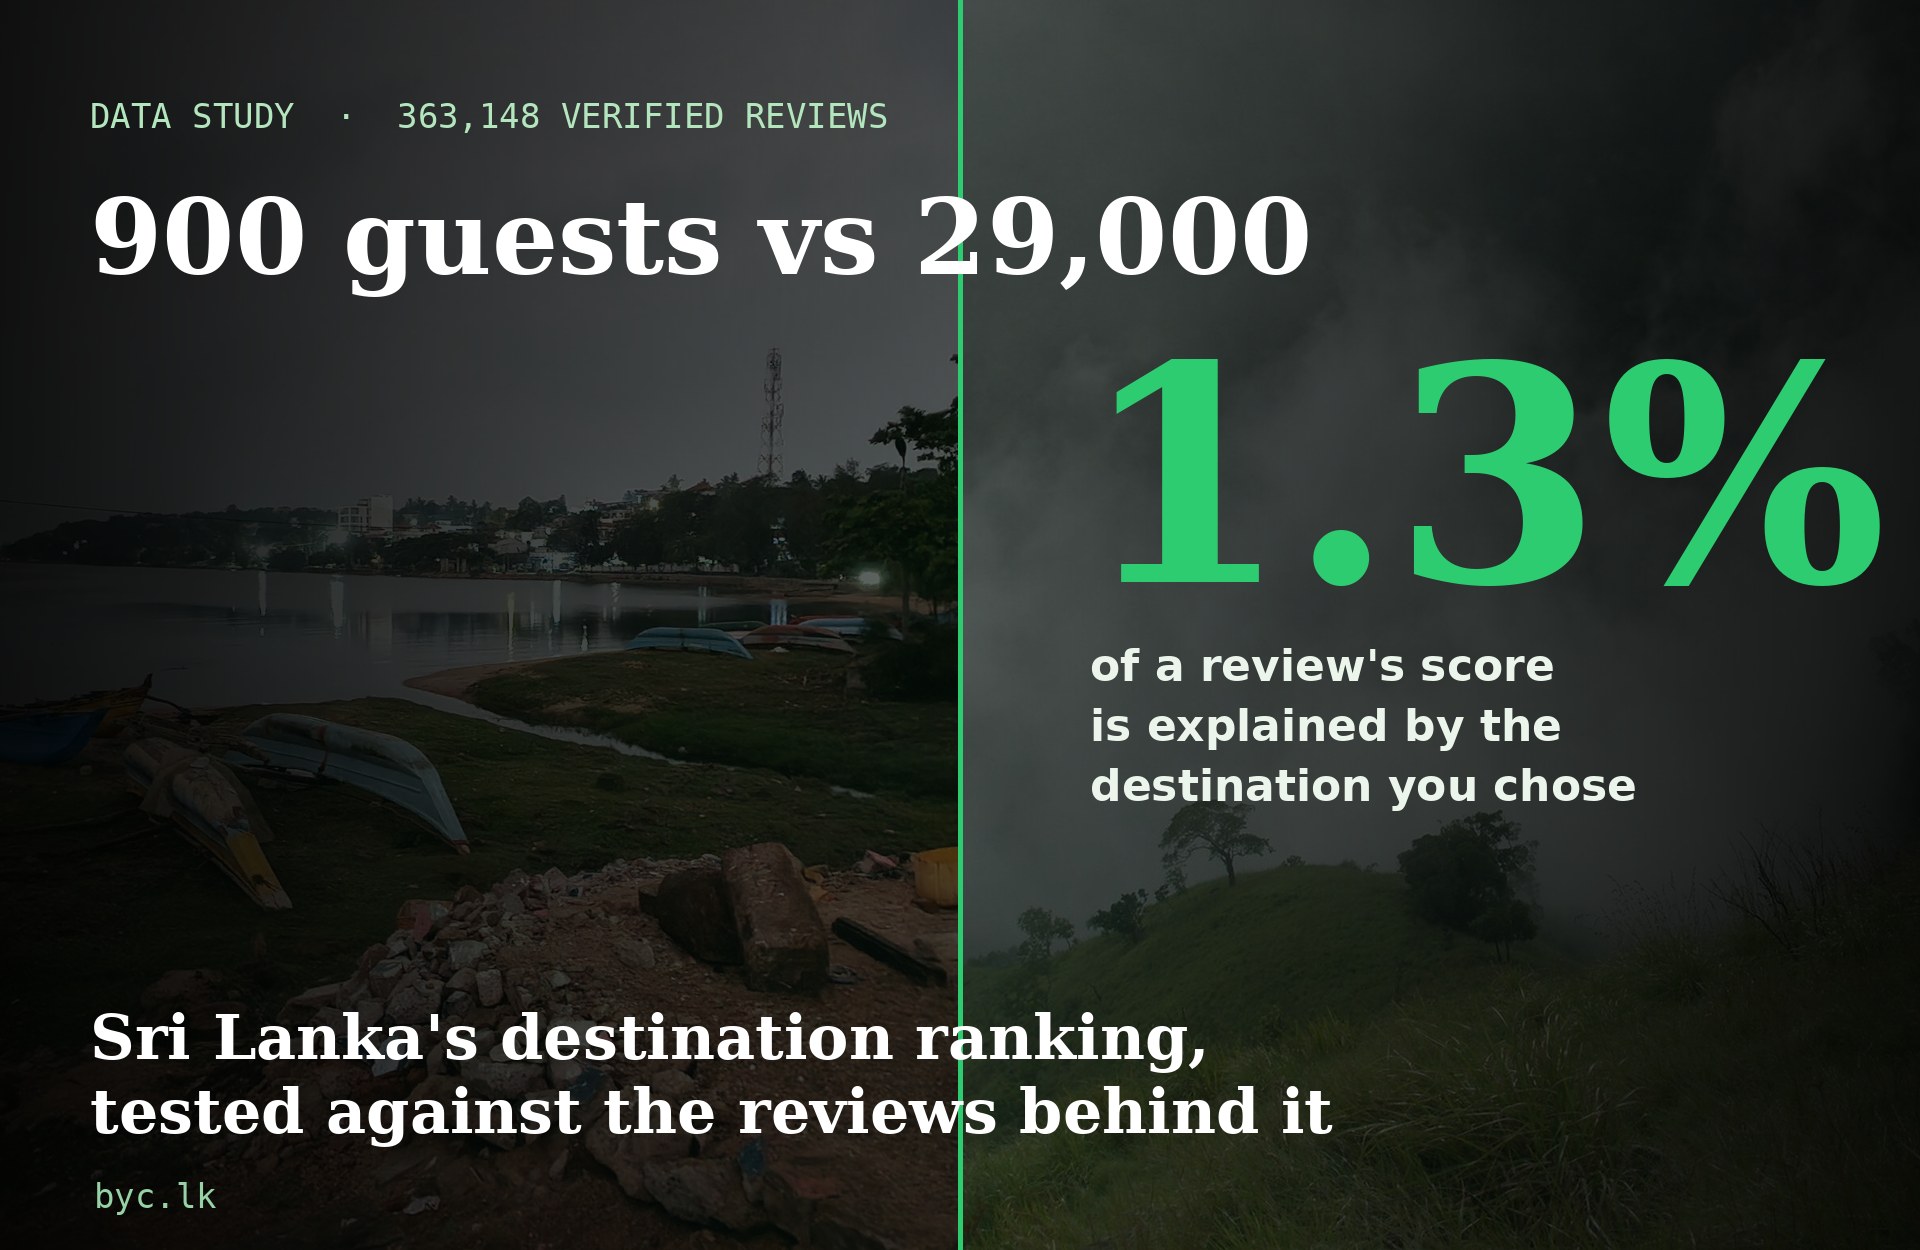
A destination average tells you almost nothing about an individual stay; it tells you something real about a region. Those are different claims and the ranking conflates them. On 363,148 reviews, the destination explains 1.3% of the variance in scores. The spread of scores inside a destination (SD 2.06) is the same as the spread across the whole island (2.09). Statistically, “where you stayed” is nearly orthogonal to “how it went”.
Two things are true at once. The ranking is a poor predictor of a booking — and the underlying averages are still worth using, as a weight of evidence about a region rather than a description of an experience. The rest of this page separates those two claims.
How We Counted
- Corpus: 363,148 reviews of Sri Lankan properties, scored out of 10, April 2024 – September 2026, spanning 30 destinations with at least 1,500 reviews each.
- Variance decomposition (measurement 1): total sum of squares of every individual score around the island mean, against the between-destination sum of squares. This yields the R² of “destination” as a predictor of a single review.
- Controlled comparison (measurement 2): 241 destination × nationality cells with at least 60 reviews (45,767 reviews). Within those cells we compute how much variance sits between destinations and how much sits between nationalities — the fairest available read on “place or person?” Nationality is self-declared and present on only 20.5% of the corpus, which we flag as a limitation below.
- Coverage and concentration (measurement 3): distinct properties per destination, the share of a destination’s reviews from its single largest property, and how many properties you need to accumulate 50% and 80% of that destination’s review count.
- Complaint mix (measurement 4): negative-framed phrase patterns (a failure that was lived, not a mention) scored separately on reviews of 8+ and reviews of 4 or less, so we can compare what goes wrong on one coast against another.
The Headline Numbers
Here is the published ranking, with two columns nobody prints next to it: the number of properties the score rests on, and the share of the destination’s reviews that come from its single largest property.
| Destination | Avg score | Reviews | Properties | Largest property's share |
|---|---|---|---|---|
| 1. Habarana | 9.17 | 4,952 | 32 | 11.19% |
| 2. Sinharaja | 9.15 | 2,955 | 26 | 9.98% |
| 3. Sigiriya | 9.05 | 22,255 | 62 | 4.14% |
| 4. Tissamaharama | 9.03 | 4,074 | 26 | 8.96% |
| 5. Tangalle | 8.88 | 9,892 | 60 | 4.89% |
| 6. Polonnaruwa | 8.85 | 5,900 | 51 | 10.03% |
| 7. Hikkaduwa | 8.84 | 8,218 | 69 | 7.09% |
| 8. Dambulla | 8.83 | 8,520 | 51 | 6.51% |
| 9. Ella | 8.82 | 29,023 | 111 | 1.96% |
| 10. Haputale | 8.80 | 4,248 | 34 | 11.18% |
| 11. Kalpitiya | 8.72 | 3,022 | 39 | 9.13% |
| 12. Matara | 8.71 | 2,885 | 28 | 8.04% |
| 13. Galle | 8.71 | 17,218 | 75 | 3.92% |
| 14. Yala | 8.69 | 15,820 | 70 | 4.29% |
| 15. Rathnapura | 8.63 | 4,184 | 40 | 7.31% |
| 16. Weligama | 8.61 | 6,989 | 53 | 11.62% |
| 17. Kandy | 8.61 | 27,550 | 79 | 4.92% |
| 18. Unawatuna | 8.60 | 9,003 | 64 | 6.33% |
| 19. Nuwara Eliya | 8.60 | 16,634 | 68 | 6.14% |
| 20. Bentota | 8.59 | 9,267 | 62 | 9.03% |
| 21. Mirissa | 8.59 | 15,528 | 71 | 5.44% |
| 22. Anuradhapura | 8.56 | 13,001 | 62 | 6.24% |
| 23. Negombo | 8.50 | 31,760 | 97 | 4.15% |
| 24. Batticaloa | 8.46 | 1,509 | 12 | 19.02% |
| 25. Nilaveli | 8.40 | 5,529 | 34 | 5.97% |
| 26. Pasikuda | 8.39 | 3,635 | 22 | 10.81% |
| 27. Arugam Bay | 8.37 | 6,105 | 53 | 3.39% |
| 28. Trincomalee | 8.33 | 10,886 | 58 | 6.08% |
| 29. Colombo | 8.26 | 34,262 | 70 | 8.99% |
| 30. Jaffna | 8.07 | 4,535 | 32 | 7.39% |
Read the right-hand columns before the middle one. Ella’s 8.82 comes from 111 properties and 29,023 reviews. Batticaloa’s 8.46 comes from 12 properties, one of which supplies 19.02% of the corpus. Those two numbers are printed in the same typeface and treated as the same kind of fact. They are not.
Measurement 1: where the variance actually lives
Take every review, subtract the island average, and square it. Then do the same after subtracting each review’s own destination average instead. If destinations mattered, the second number should be much smaller than the first. It is not.
Destination as a predictor of one review: R² = 0.0134.
Spread of scores inside a destination: 2.06. Spread of scores across the whole island: 2.09. Knowing the destination removes 1.3% of the uncertainty. The other 98.7% is the property, the room, the week, the weather, and the guest.
This is not an argument against the ranking; it is an argument about its resolution. A destination average is a statement about a population of stays. When you book one property, you draw a single sample from that population — and the population is wide enough that the draw dominates. Two guests in the same destination a week apart routinely land three points apart, and neither of them is wrong.
Measurement 2: place or person?
The ranking has a quieter flaw: destinations are not reviewed by the same people. In the controlled comparison — cells of destination × nationality, each with at least 60 reviews — we can finally separate the two.
Between-cell variance: destination 55.17%, nationality 16.85% (241 cells, 45,767 reviews).
On a controlled basis the destination spread is about 0.15 points. The nationality spread is 0.89 points — roughly six times larger.
| Nationality (controlled mean) | Score |
|---|---|
| Austria | 9.36 |
| Russia | 9.07 |
| United States | 9.06 |
| China | 8.99 |
| France | 8.94 |
| Germany | 8.92 |
| Australia | 8.89 |
| United Kingdom | 8.89 |
| Spain | 8.87 |
| New Zealand | 8.85 |
Who is holding the pen matters more than where the pen is. Austrian guests average 9.36 across the same controlled cells where Bangladeshi guests average 8.47. The top destination and the bottom destination on the controlled basis are 0.96 points apart — but that is a spread across 26 destinations, whereas 0.89 points separates just the top and bottom nationality. Per unit of comparison, nationality discriminates more.
Measurement 3: how many hotels is a destination?
The east coast is where the coverage problem is sharpest. Its rankings rest on a handful of properties, and one of them can carry a fifth of a town’s evidence.
| Destination | Avg score | Properties needed for 80% of reviews | Total properties | % of properties | |
|---|---|---|---|---|---|
| Ella | 8.82 | 29,023 | 111 | 71 | 64% |
| Negombo | 8.50 | 31,760 | 97 | 55 | 57% |
| Galle | 8.71 | 17,218 | 75 | 44 | 59% |
| Mirissa | 8.59 | 15,528 | 71 | 44 | 62% |
| Kandy | 8.61 | 27,550 | 79 | 43 | 54% |
| Yala | 8.69 | 15,820 | 70 | 41 | 59% |
| Hikkaduwa | 8.84 | 8,218 | 69 | 39 | 57% |
| Nuwara Eliya | 8.60 | 16,634 | 68 | 39 | 57% |
| Anuradhapura | 8.56 | 13,001 | 62 | 38 | 61% |
| Colombo | 8.26 | 34,262 | 70 | 37 | 53% |
| Jaffna | 8.07 | 4,535 | 32 | 19 | 59% |
| Matara | 8.71 | 2,885 | 28 | 17 | 61% |
| Sinharaja | 9.15 | 2,955 | 26 | 17 | 65% |
| Tissamaharama | 9.03 | 4,074 | 26 | 17 | 65% |
| Pasikuda | 8.39 | 3,635 | 22 | 12 | 55% |
| Batticaloa | 8.46 | 1,509 | 12 | 7 | 58% |
Pasikuda has 22 properties and rests on 47.79% of its reviews from its five largest. Nilaveli has 34. Ella has 111 and needs 71 of them to reach the same 80%. When a destination’s score is the average of twelve properties, a single renovation, a single management change, or a single very good hotel moves the number more than the destination itself did.
Measurement 4: the east coast is not a worse product
If the low east-coast score reflected a worse product, low-scoring reviews there should complain about different things than low-scoring reviews in the south. They do not.
| Coast | Avg | Share ≤4 | Reviews | Properties | 'Spotless' in 8+ reviews | Cleanliness in ≤4 reviews | Hot water in ≤4 | Noise in ≤4 |
|---|---|---|---|---|---|---|---|---|
| East coast | 8.34 | 9.8% | 23,000 | 179 | 5.2% | 13.35% | 3.64% | 4.35% |
| South coast | 8.69 | 7.4% | 62,898 | 482 | 4.8% | 13.42% | 2.94% | 6.72% |
| West coast / Colombo | 8.39 | 7.63% | 51,866 | 206 | 4.39% | 11.22% | 1.84% | 4.95% |
| Hill country | 8.75 | 6.08% | 40,167 | 222 | 3.8% | 14.38% | 5.45% | 6.76% |
| Cultural Triangle & parks | 8.82 | 6.1% | 69,448 | 452 | 4.42% | 12.69% | 3.33% | 4.94% |
Cleanliness appears in 13.35% of east-coast reviews scoring 4 or less, and 13.42% of south-coast ones. The positive rate for words like “spotless” is 5.2% on the east coast against 4.8% in the south. Two genuine differences exist, and both are cost facts rather than quality facts: hot-water failures run 3.64% on the east coast against 2.94% in the south, and noise complaints run lower on the east (4.35%) than in the south (6.72%). The first is what a smaller, less-renovated supply looks like; the second is what an emptier coast sounds like.
Who reviews the east coast
The ranking’s east-coast entries are judged by a different jury. Below: the share of each destination’s nationality-tagged reviews coming from European markets that rate Sri Lanka hardest, the ratio against the generous markets, and the property count behind the score.
| Destination | Avg score | Strict-market share | Strict : generous | Properties |
|---|---|---|---|---|
| Trincomalee | 8.33 | 49.65% | 2.75x | 58 |
| Nilaveli | 8.40 | 59.38% | 4.07x | 34 |
| Pasikuda | 8.39 | 41.07% | 1.76x | 22 |
| Arugam Bay | 8.37 | 46.62% | 2.08x | 53 |
| Mirissa | 8.59 | 32.8% | 1.95x | 71 |
| Galle | 8.71 | 26.23% | 1.03x | 75 |
Nilaveli is the extreme case: 59.38% of its tagged reviews come from the strict markets, a ratio of 4.07x. When we compare each destination within the same credentials, the east-coast gap narrows but does not disappear: Arugam Bay has the largest reviewer gap in the country (+0.33) and Trincomalee’s shrinks to +0.12. That is the honest conclusion — some of the east coast’s low score is who is writing, and some is genuinely a thinner, older, less-maintained supply of rooms. The ranking prints one number and implies it is all the first thing, or all the second.
What this means for your trip
- Use the destination average to choose a region, not a hotel. A destination score is a weight of evidence: Sigiriya, Habarana and Sinharaja really do have unusually consistent supply. It is not a forecast for your room.
- Prefer a property with a deep review history over a destination with a high average. A property with 300+ reviews has a score you can act on. A destination’s 0.2-point lead over another is inside the noise.
- Treat a low score from a small town cautiously. If a destination has fewer than 30 reviewed properties, the average is a statement about those hotels, not about the place.
- If you are choosing between the east and the south: choose on season. The score gap between them is smaller than the gap between two nationalities staying in the same town, and the east coast’s low end is driven by hot water and insects rather than by anything structural. Our review ledger and Trincomalee verdict both point the same way.
- If you are a hotelier: your destination’s average is largely outside your control; your property’s average is entirely inside it. The destinations with the tightest within-destination spread are the ones where service quality is consistent — which is the thing that actually compounds.
WATCH OUT FOR
- The reviewer-mix effect is real but not universal. It is strongest in Nilaveli and Trincomalee and it does not explain Jaffna (whose gap runs the other way). We are not claiming the east coast’s ranking is an artefact; we are quantifying how much of it is.
- Nationality coverage is 20.5%. The controlled comparison rests on that subset, and nationality-tagged reviewers score slightly higher than the untagged population. The 1.3% R² and the coverage figures use the full corpus; the decomposition uses the subset and is labelled as such.
- Score scale changes happen. Properties sometimes change their scale or their review platform. We use the reviewer’s own out-of-10 score, which is consistent across the corpus.
- A low R² is not a scandal. Most human-experience ratings behave this way — it means the ranking is a weak instrument, not that the data is wrong.
GOOD TO KNOW
- Destination explains 1.3% of a single review’s score; property, room, week and guest explain the rest.
- Nationality is the largest single measured effect in the corpus: 0.89 points between the top and bottom market on a controlled basis.
- Coverage is the hidden variable: 12 properties in Batticaloa, 22 in Pasikuda, 34 in Nilaveli, 111 in Ella.
- The complaint mix is flat across coasts: cleanliness 12.7–14.4% of low-scoring reviews everywhere.
- Hot water is the east coast’s genuine weak point (3.64% of low-scoring reviews vs 2.94% in the south) — a maintenance fact, not a location one.
WHERE TO STAY
If you take one rule from this study, take this one: choose the region on season and access, and choose the property on its own review history. Our data-ranked list of the highest-rated stays is built from properties with deep review histories rather than from destination averages, and the bad-tail study shows the same destinations ranked by the share of guests who scored 4 or lower — a measure that survives the small-sample problem because it is about the tail, not the mean.
The ranking this study would publish instead
If the destination average is a weak instrument, the obvious next question is what to replace it with. Our answer is not a better average — it is the spread inside the destination, because that is the thing a traveller actually experiences: not “what does this town average” but “how wide is the gap between its best and worst night”.
Within-destination standard deviation, across all 30 destinations: Habarana, Sigiriya, Sinharaja and Tissamaharama are the most consistent (SD 1.57–1.84) and Batticaloa, Arugam Bay and Jaffna the least (SD 2.32–2.50). Every east-coast destination sits in the wider half of the table, which is what a thinner supply of properties looks like when you measure it directly instead of through an average.
That measure has a practical use the ranking lacks: it tells you whether to book early in a destination. Where the spread is wide, the property you pick matters enormously and the difference between the best and the worst stay is three points. Where the spread is tight, almost any well-reviewed property will do.
Closing
The destination ranking is not wrong. It is being asked to do a job it cannot do. Habarana’s 9.17 is a true statement about a population of 4,952 stays, and a nearly useless statement about the room you are looking at tonight. The data that will actually help you is smaller and less shareable: a property, its last 300 reviews, and what the low ones complain about.
That is the work we do — and the reason this page exists is to say plainly where our own most-quoted number stops being useful.
Frequently asked
Is Sri Lanka's destination ranking meaningful?
Barely. Across 363,148 reviews, the destination a guest stayed in explains only 1.3% of the variance in the score they gave. The standard deviation of scores inside a single destination (2.06) is almost identical to the standard deviation across the whole island (2.09), which is the statistical way of saying that a destination label predicts almost nothing about how one particular stay will go.
Why do Trincomalee and Nilaveli score lower than the south coast?
Partly because they are judged by different guests. 59.38% of Nilaveli's nationality-tagged reviews come from European markets that rate Sri Lanka hardest (4.07x the south-coast rate). When you compare the east and the south within the same credentials, the gap shrinks: Arugam Bay still shows the largest reviewer gap on the island (+0.33), but Trincomalee's shrinks to +0.12 — and the complaint mix on low-scoring reviews is the same on both coasts.
How many hotels does a Sri Lanka destination score actually rest on?
In the north and east, very few. Batticaloa's ranking rests on 12 properties and its largest property alone supplies 19.02% of the town's reviewed corpus; Pasikuda has 22 properties; Nilaveli has 34. Compare Ella, which has 111 properties. A 0.2-point difference between a 12-property town and a 111-property town is not a verdict on the town.
Which nationality rates Sri Lanka highest?
In the controlled comparison (destination x nationality cells with at least 60 reviews), Austrian guests average 9.36 and Bangladeshi guests 8.47 — a spread of 0.89 points. The destination spread on the same controlled basis is about 0.15 points. Who you are matters far more than where you went.
Should I skip the east coast because of the scores?
No. The east coast's hotels are graded on the same things as the south's: on low-scoring reviews, cleanliness is mentioned at 13.4% on the east coast against 13.4% in the south, and the positive rate for words like 'spotless' is 5.2% against 4.8%. The difference in the average is a difference in who reviewed and how many properties were reviewed — not evidence of a worse product.
What should I use instead of a destination average?
A small set of properties with deep review histories. A destination score is an average across properties that differ by three points; a single property with 300+ reviews has a score you can actually act on. Use the destination average to pick a region worth visiting, and the property's own review history to pick where you sleep.
Dig deeper: the full 363K review analysis · the bad-tail ranking · what actually breaks a stay · nationality satisfaction study · review statistics · ask the BYC chatbot to plan your route.
Have a specific question about your Sri Lanka trip?
Ask BYC at byc.lk — Free and honest. Some links are affiliate links and never change our advice.
Ask BYC Your Question →